Month: November 2019

#WORKOUTWEDNESDAY2019 WEEK 48

#WORKOUTWEDNESDAY2019 WEEK 48

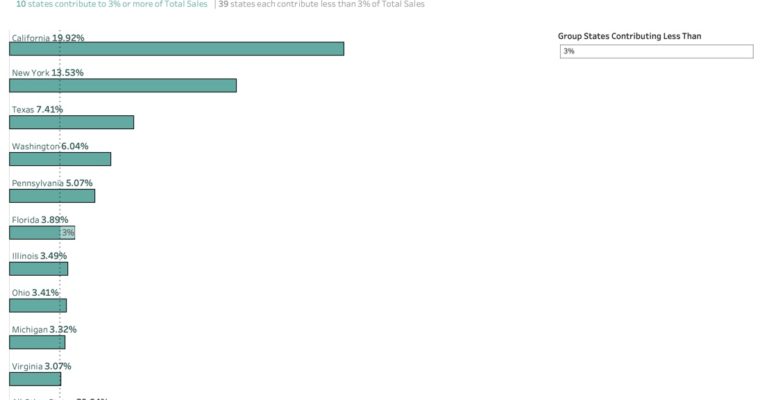
Can you build a bar chart that automatically combines small contributions? Requirements Dashboard 1100 x 900 – 1 sheet Create a bar chart that dynamically combines States based on the percentage of total contributing Sales For states beneath the threshold, they should be combined into…
Let’s Talk about Data Quality

Let’s Talk about Data Quality

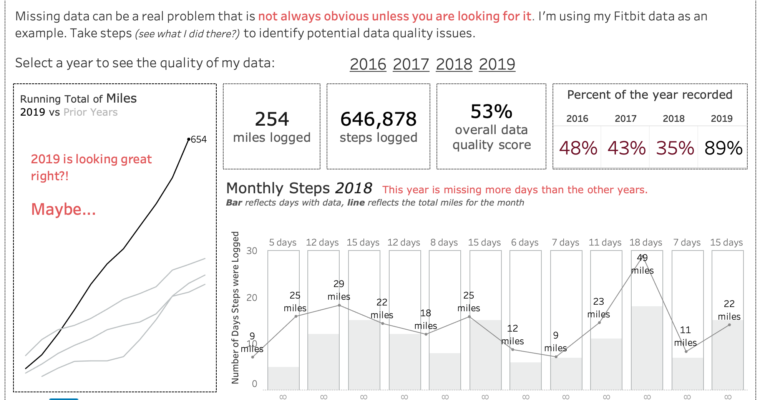
Establishing trust in reporting starts with data quality. I put this dashboard together to monitor the quality of my Fitbit data.

#WORKOUTWEDNESDAY2019 WEEK 47

#WORKOUTWEDNESDAY2019 WEEK 47

Recreate this high level sales dashboard