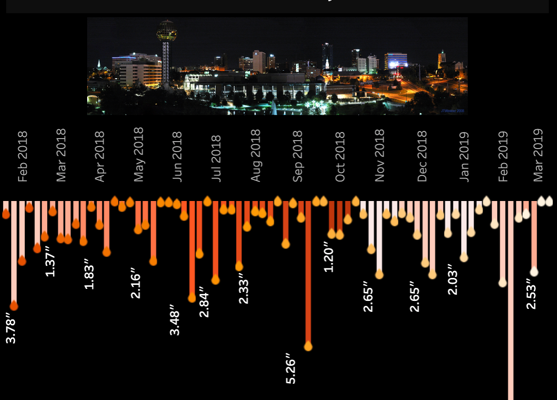
A Year of Knoxville Rainfall
Recent flooding in my hometown lead me to wonder how much rain did we get in one day compared to a normal year.
Making the world a better place by helping people understand their data.
Recent flooding in my hometown lead me to wonder how much rain did we get in one day compared to a normal year.
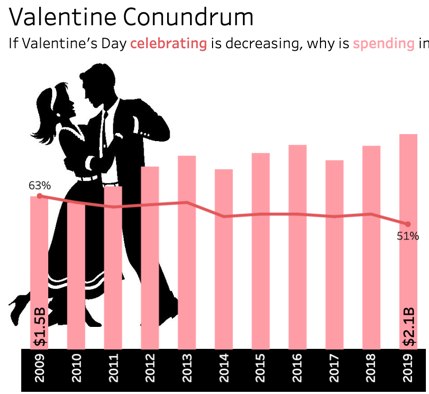
#MakeOverMonday 2017 – Week 7 Less people are celebrating Valentine’s day. However spending on the holiday has increased 12%. Why?
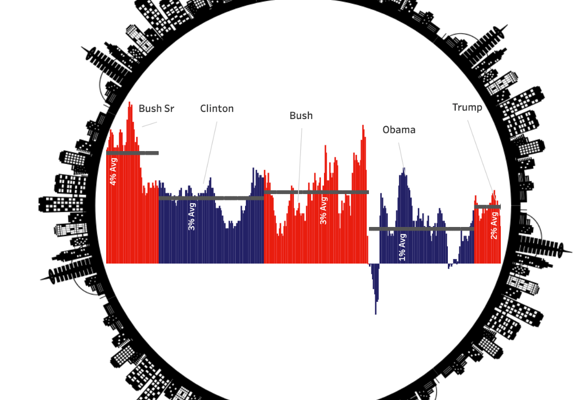
Hover to see details. The bar across each presidential term is the average for that entire term.
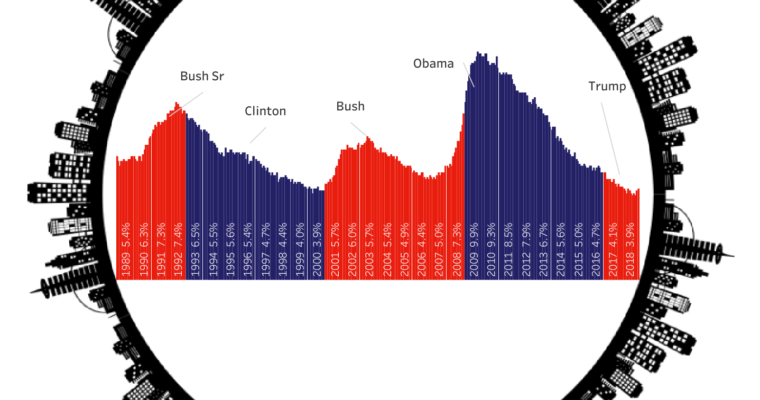
Welcome to my series on key economic indicators. I thought it would be interesting to slice by U.S. President. Hover over the barchart to see more details.This data comes from the U.S. Bureau of Labor Statistics
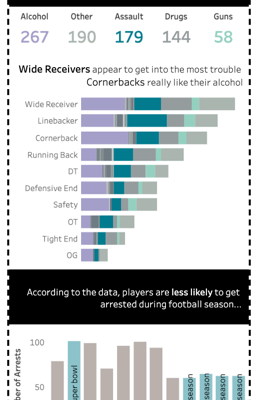
I’m not your typical sports fan. As in, I don’t follow football at all. However, we had a team project to do something with this data. Here is what I came up with…