2018 Tableau Conference – Monday Pre-Game
Monday October 22nd
Session: #VIZforSocialGood
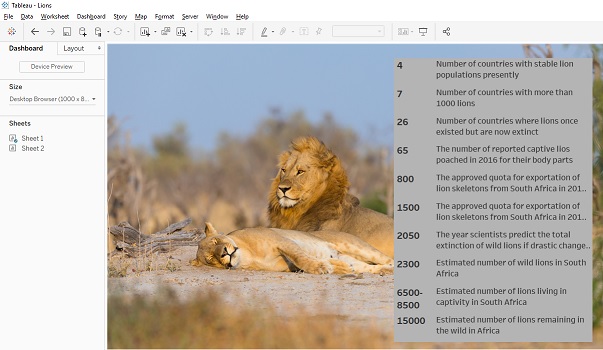
- Learned how to put a background image on an entire dashboard. (Something I hadn’t been able to figure out before)
- Learned that Lions are soon going to be extinct 🙁 Details: https://www.vizforsocialgood.com/join-a-project/2018/9/16/kevin-richardson-foundation
Session: MakeOverMonday
Increase your Tableau skills by practicing on data sets released every Sunday.
Dashboards go up by Monday to show off and compare your dashboard skills to others.
- Download tableau public desktop (free)
- Create a Tableau public profile public.tableau.com (also free)
- Every Sunday a data set is released, .
- Post your dashboard link to twitter with hashtag #MakeOverMonday
- Learn how others tackle visualization of data compared to you.
- Best Practices:
- Write down the question you are trying to answer
- Draw out your dashboard on paper before you begin
Our challenge was to make over a dashboard on beer prices at major league baseball games.
Here are all of the variations.
My favorite: Tim Lafferty
#makeovermonday 43: The Price of Beer Over 5 Years by #MLB franchise. Not practical, but I had an idea and wanted to see it through. #tableau #dataviz pic.twitter.com/1wuHhsUWEX
— Tim Lafferty (@TimFromVelocity) October 24, 2018
I had some time after this session so…
Scavenger hunt! (find all ten “Aggre-gators” and win a prize) I only found three or four.



Welcome Reception:
An announcement was made that free exam vouchers would be handed out to the first 1000 people that came to the community booth during the welcome reception….
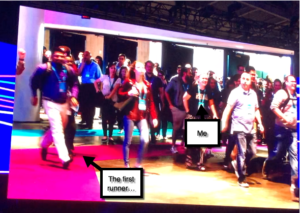
It was like Black Friday: I got to the door 30 minutes early. A guy next to me was asking me why I was there so early, fishing to see if I knew about the voucher.
The doors opened and everything went crazy we all took off. (No one was trampled, I did manage to be one of the 1,000!) It was apparently all caught on film and shown at the keynote.
There was amazing food, a playground, vendors, and a parade… right through the middle of the reception.
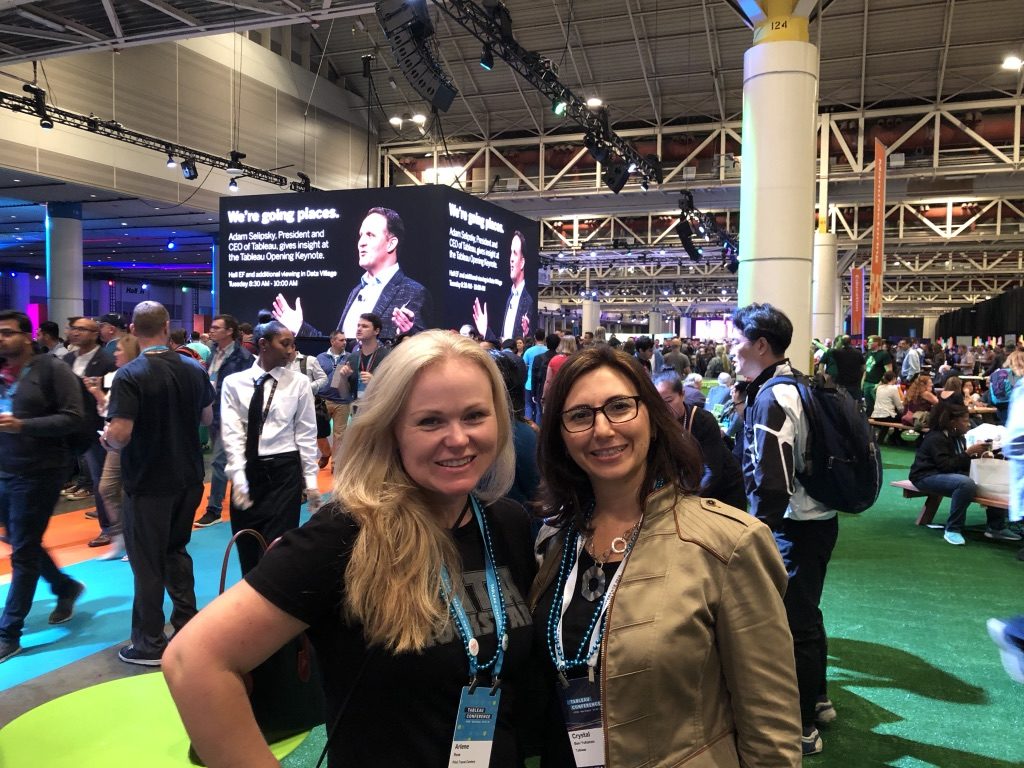
Met our sales rep Crystal and Ethan (Ethan is taking the photo)
“Gamification” of your data was a common buzz word.How do you clean your data? With Soap! Duh.
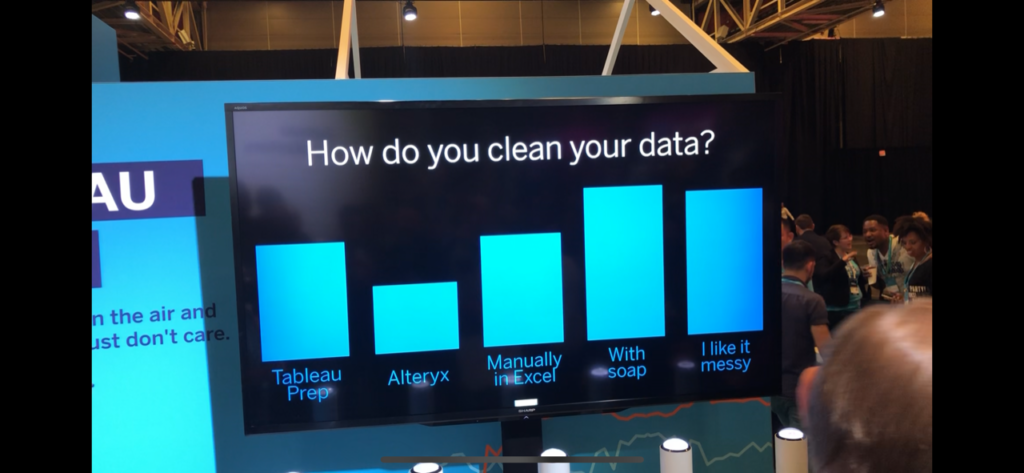
Tableau store had some funny items:
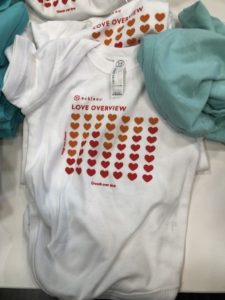
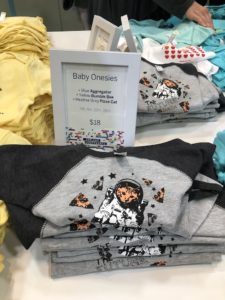

Because who doesn’t need golf balls and a baby onesie?
Check back later for more details on day one. 🙂