#WORKOUTWEDNESDAY2019 WEEK 48
Can you build a bar chart that automatically combines small contributions?
Requirements
- Dashboard 1100 x 900 – 1 sheet
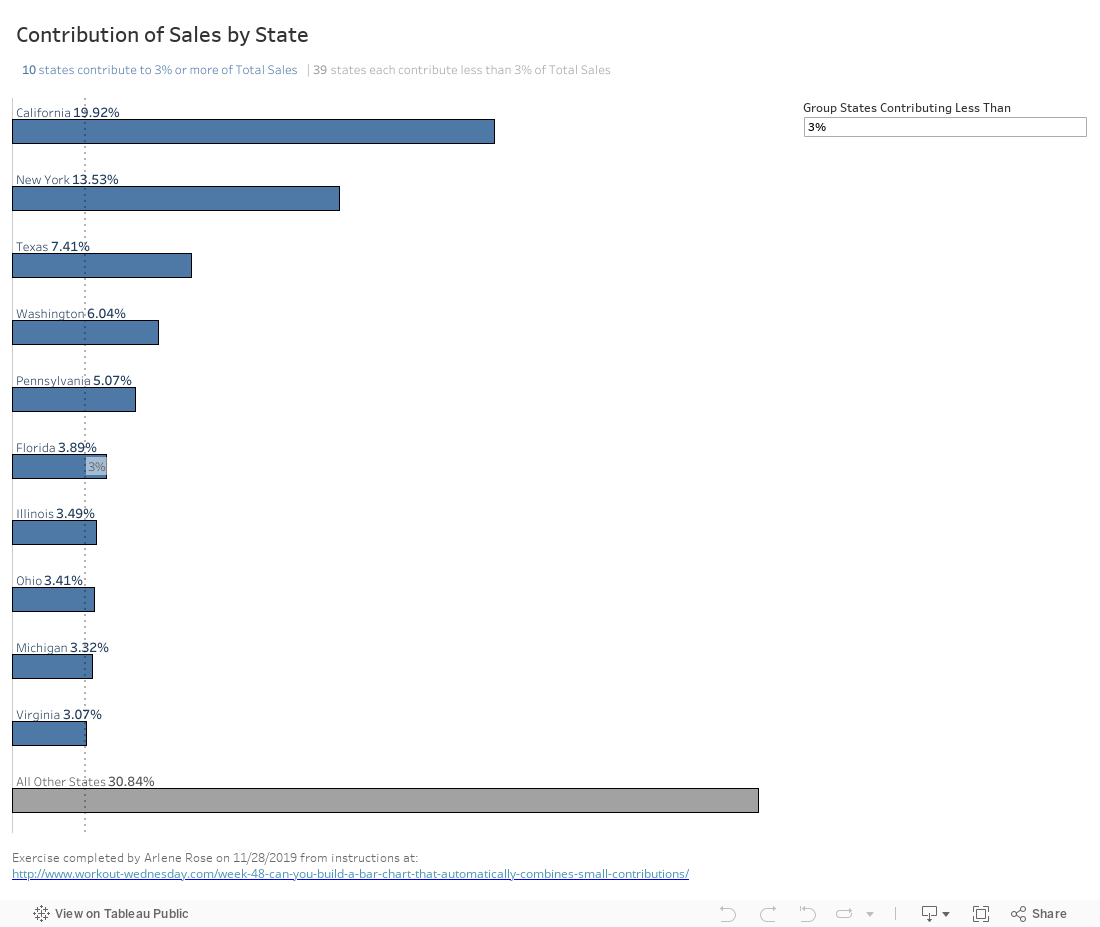
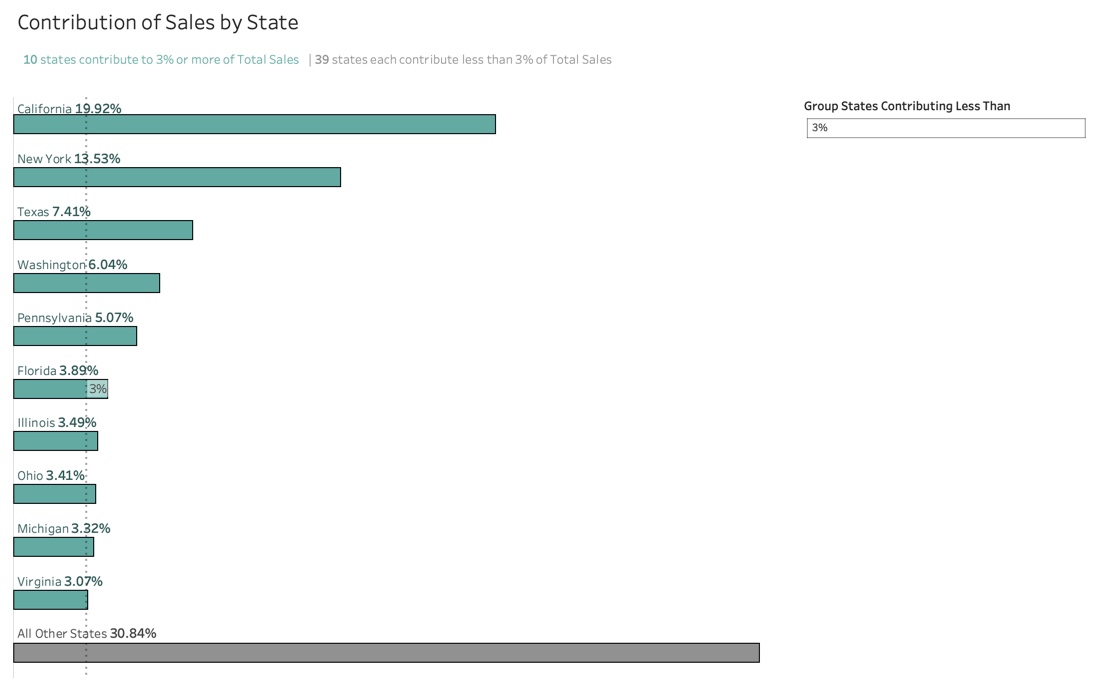
- Create a bar chart that dynamically combines States based on the percentage of total contributing Sales
- For states beneath the threshold, they should be combined into one bucket called “All Other States”
- This should be at the bottom of the bar chart
- The rest of the states that contribute more than the threshold should be displayed in descending order
- Tooltips for state names should be blue for the blue bars and gray for the “All Other States” bar
- Labels for bars should be sitting on top of the bar
- Construct a subtitle that shows the number of states in blue and the number in gray
- Match any remaining formatting
Dataset
This week uses the Superstore Data Set from 2019.3 (it goes through the end of 2019)